Design case · Independent product and design system concept · 2026
A desk for the afternoon things go sideways.
LEDGERLINE is the operations dashboard of an invented Lagos courier: 300 parcels a day on motorbikes, a lot of them paid in cash at the door, delivered to addresses that are often a landmark and a phone call. The question was what an ops lead needs on screen at 14:32 on a Monday, and what system a small product team would need to keep building it without it falling apart.
- The brief
- Self-set. Design complex, data dense B2B software and the design system behind it, for a context I know: Lagos, cash, bikes, patchy networks.
- My role
- Everything: desk research, product thinking, information design, interaction, visual design, tokens, component documentation and the front end.
- Delivered
- A working desk with 300 seeded shipments, an exceptions queue with three resolve flows, roles and hard states; a system site with tokens.json; this case.
01 / The problem
The parcel is easy. The exceptions are the job.
Most deliveries in a day go fine and nobody needs to look at them. The work of an ops desk is the small share that does not: the customer who is not home, the street number that does not exist, the transfer that has not landed, the rider holding ₦300,000 in cash at 6pm.
Two things make Lagos last mile its own problem. Addresses are often descriptive rather than precise, so riders find doors by landmark and by phone, and a pin on a map can be well off the real door [4]. Cash on delivery is still a real share of online payments in Nigeria, between roughly 15% and 17% depending on the source and year [1][2], and industry voices describe it as a drag on the sector [3]. Every cash parcel is money that has to be counted back in.
Assumption, labelled: I am assuming a small courier like this one runs its day today on WhatsApp groups, a shared spreadsheet and phone calls. That is common in small operators but I have not verified it for any specific company.
02 / Users and jobs
Three people, one screen, different questions.
Owns the day. Watches the on-time rate, unblocks the queue, decides when to return a parcel. Lives on a laptop, glances at a phone in traffic.
When something goes wrong, I want to see the oldest problem first with everything I need to decide, so I can clear it before it breaches.
Matches riders to parcels. Reassigns when a rider is overloaded or a bike breaks down. Wants density and keyboard speed.
When work piles up in a zone, I want to see who is free nearby and move ten parcels at once, so riders do not sit idle.
Counts the cash back in. Matches transfers to parcels, chases short payments, writes the reconciliation report.
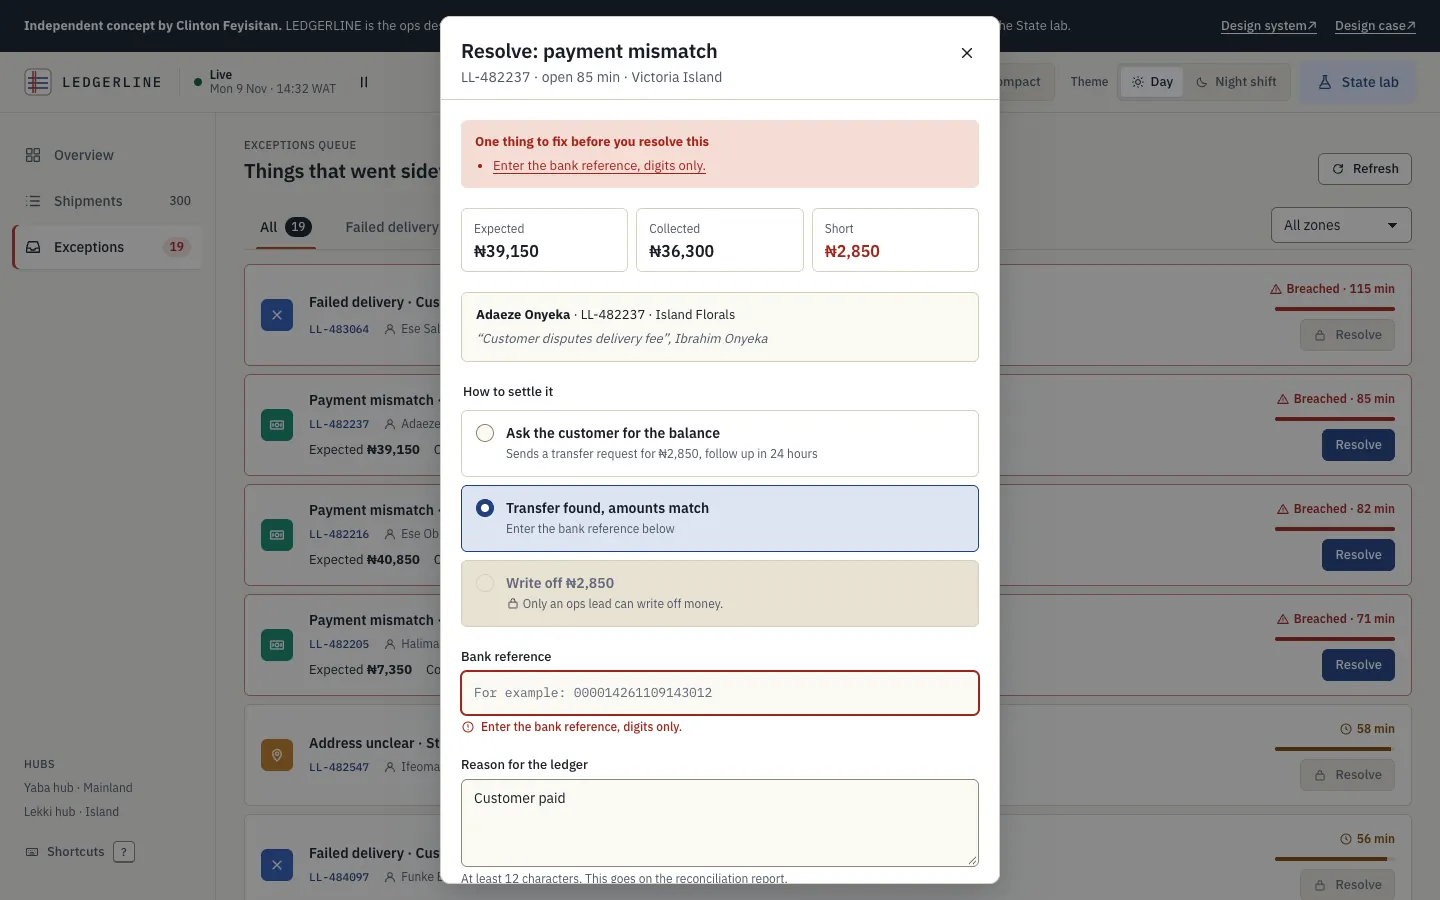
When a rider comes back with less than expected, I want the expected, collected and short amounts side by side, so I can settle it with a reason an auditor will accept.
Merchant success, a manager, an auditor. Needs to see everything and export, should not be able to change anything.
When a merchant calls, I want to find their parcel by name or phone digits and read its timeline, without fear of breaking something.
03 / Research
Desk research, not interviews.
I did not speak to riders, dispatchers or finance staff for this concept, and I have not used any real company's data. What I did was read about the context and about how good data tools are built, and design to be tested.
- Statista, distribution of e-commerce payment methods in Nigeria, 2022: cash on delivery level with credit cards at 17%, behind bank transfer and debit card. statista.com
- Intelpoint, citing Worldpay, on digital wallets in Nigerian e-commerce: cash on delivery about 15% of transactions in 2023, forecast to fall to about 9% by 2027. intelpoint.co
- Nairametrics, June 2025: stakeholders warn that pay on delivery is hurting e-commerce growth. nairametrics.com
- Techpoint Africa, 2020, on the challenges of e-commerce logistics in Nigeria, including addressing; and The Guardian Nigeria on NIPOST's agreement to adopt what3words addressing. techpoint.africa · guardian.ng
- Nielsen Norman Group, Data tables: four major user tasks (find, compare, view or edit one row, act on many). This became the checklist for the shipments view. nngroup.com
- IBM Carbon data table guidance, for batch actions, row density and toolbar patterns. carbondesignsystem.com
- WAI-ARIA Authoring Practices: the sortable table, tabs and modal dialog patterns. sortable table · tabs · dialog
- WCAG 2.2 understanding documents: contrast, target size, timing adjustable and pause, stop, hide. contrast · target size · timing · pause, stop, hide
- Design Tokens Community Group, for the tokens.json format; GOV.UK Design System as the model for documenting components with usage and accessibility side by side. designtokens.org · design-system.service.gov.uk
04 / Constraints
Designed for the bad day, on the cheap laptop.
- Networks drop. The desk has to say how old its data is, keep working read only, and queue changes rather than lose them.
- Money is involved. Anything that moves or writes off cash needs a reason, a role check and an audit line.
- Mixed screens. A 13 inch laptop at the hub, a phone in a car. The phone is for triage, not for bulk reassigning 40 parcels.
- Long, real names. Yoruba, Igbo and Hausa names, compound surnames, addresses written as directions. Nothing can assume short strings.
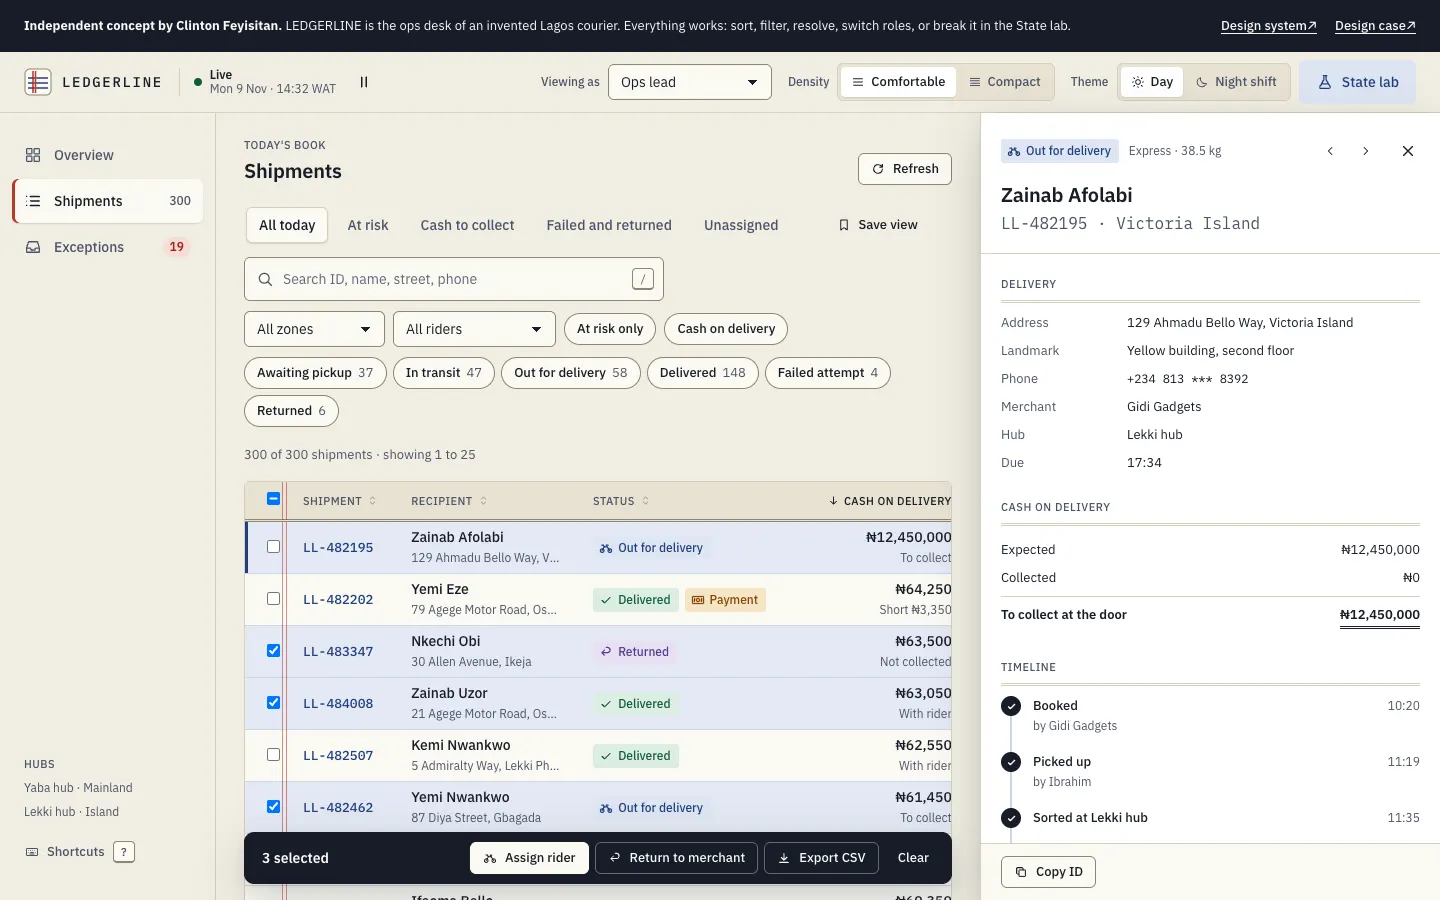
- Extreme numbers. A ₦2,500 small chops order and a ₦12,450,000 bulk phone order sit in the same column.
- Shared desk, different rights. Roles change what you can do, never what you can see.
05 / Options
Why the table beat the map.
The obvious logistics dashboard is a map full of moving dots. It looks like control. I sketched four directions and asked of each: does it answer "what is wrong and what do I do about it" faster than the others?
06 / Hierarchy
What the ops lead sees, in the order they need it.
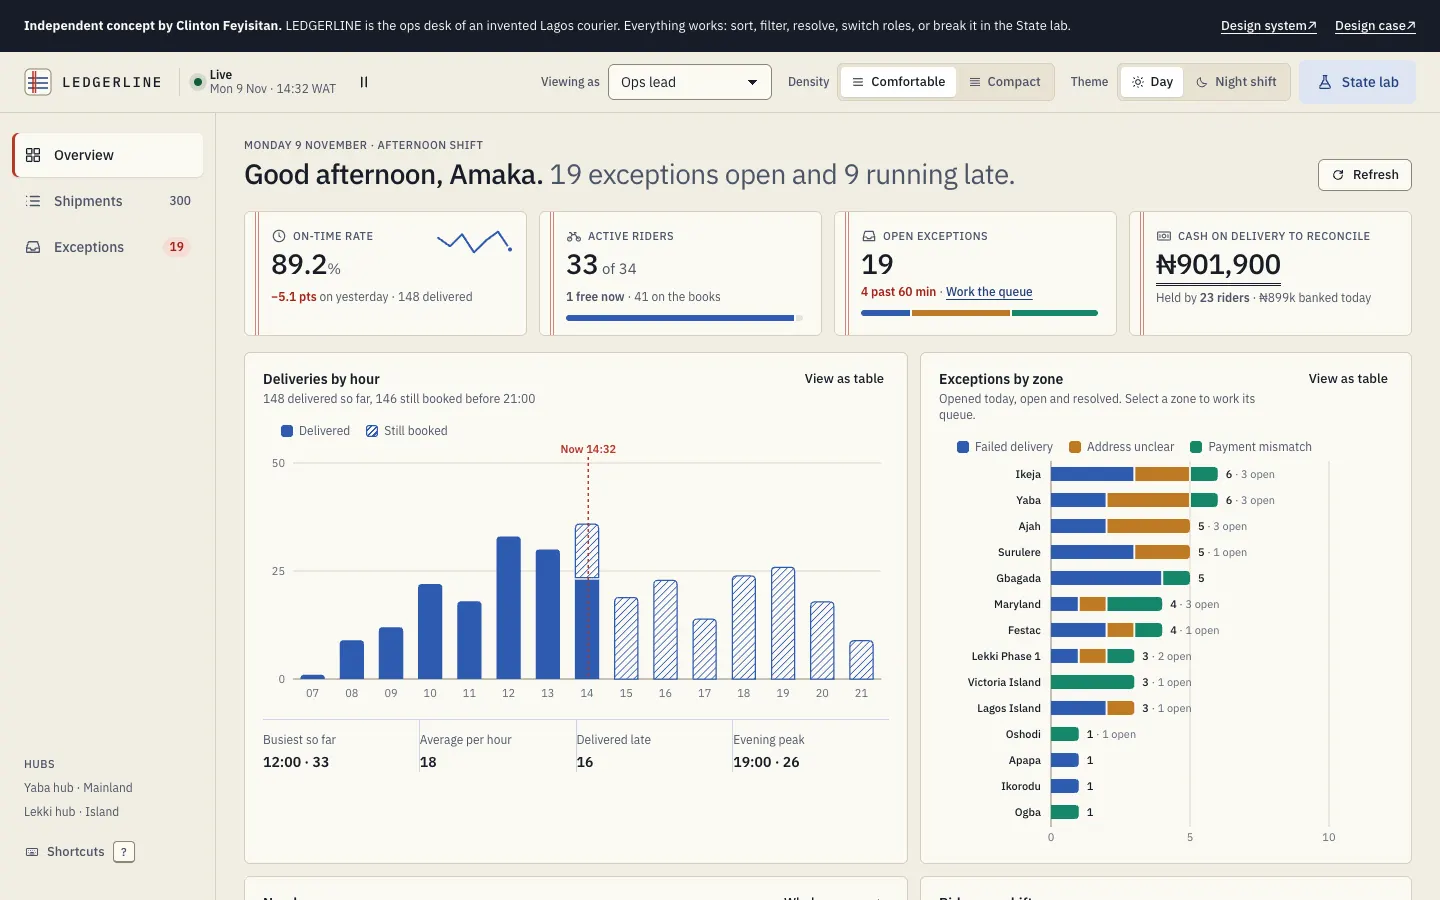
- A sentence, not a dashboard title. The headline is the state of the day: how many exceptions are open and how many parcels are running late, rewritten live.
- Four figures that each lead somewhere. On-time rate (are we OK), active riders (can we cope), open exceptions (what is waiting), cash to reconcile (what is at risk). Each has a direction or a link, so no tile is just decoration.
- Two charts that answer two questions. When is the evening peak, and where is it going wrong. The zone chart opens the queue for that zone.
- Needs you now. The five oldest exceptions with a Resolve button, because the overview should be actionable without a click elsewhere.
- The row as a sentence. Who, where, with whom, what state, by when, for how much. Columns hide by priority as space shrinks: updated, then merchant, then zone, then rider, then the due time, which the side panel still shows. Below 640px the table turns into cards that keep the same order.
07 / Decisions
Choices I would defend in a review.
08 / Hard states
The bad day, designed.
Every state below can be triggered from the State lab on the desk, so a reviewer does not have to take my word for it.
| State | What you see |
|---|---|
| First load, slow network | Skeletons shaped like the KPI tiles, charts and rows, so nothing jumps when data lands. aria-busy on each region. |
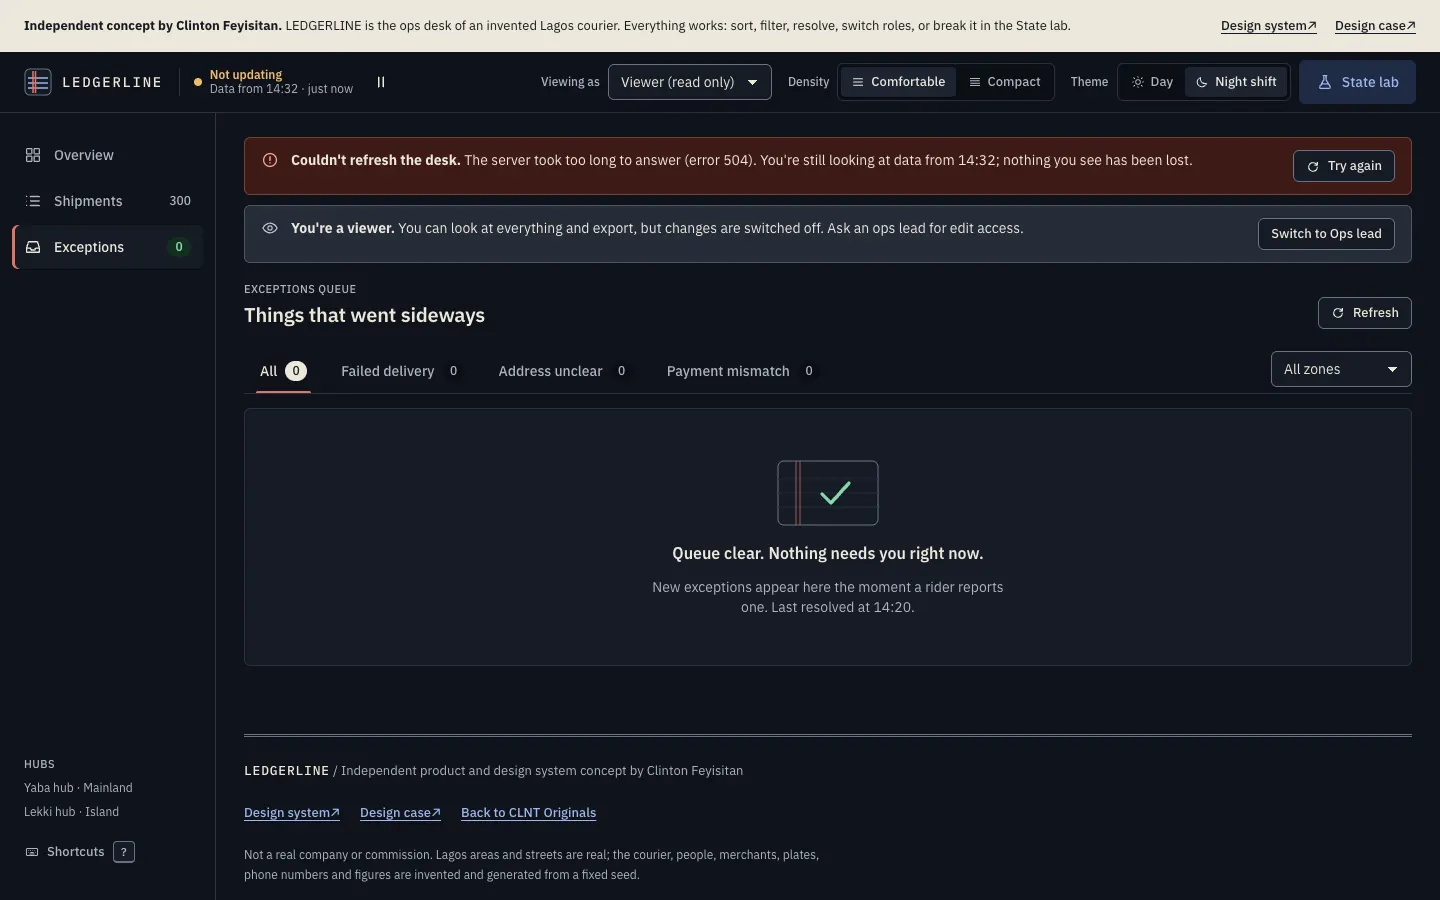
| Refresh fails | A red banner with the error code, the time of the data still on screen, and Try again. The data stays. |
| Offline | An amber banner, the live dot turns amber and says "Offline · data from 14:32". Resolutions and notes queue with a visible Queued badge, then send on reconnect with a toast. |
| Filters match nothing | The empty state repeats the filters back in bold and offers Clear the search or Clear all filters. |
| Queue clear | A quiet ledger tick and "Nothing needs you right now", with when the last one was resolved. |
| Viewer role | A banner explains the role; every write action shows a lock and a reason, and pressing it explains in a toast. Export still works. |
| Long text | A 90 character merchant name and a directions style address truncate in the table, keep the full text in a tooltip and wrap in the panel. |
| Extreme numbers | ₦12,450,000 in a column of four figure sums keeps tabular alignment; KPI tiles shorten money to ₦1.44m only on narrow phones. |
| Zero | A rider on shift with no parcels is listed as free, not hidden; an empty chart bar is shown, not skipped. |
| Breached | Exceptions past 60 minutes get a red border, a warning icon and the word Breached, not only a colour. |
09 / The system
How a team stays consistent without a design police.
- One source of truth. Tokens live in one module. A build script generates the CSS and a DTCG style tokens.json, so the web desk, a future rider app and a Figma library read the same values.
- The build checks contrast. Twenty contrast pairs are declared next to the colours. If someone changes a value and breaks a pair in either mode, the build refuses to write. Accessibility is a failing test, not a review comment.
- Components only use roles. No component knows a hex value or a pixel size outside the scale. Night shift and compact density are value swaps, not forks.
- Docs show every state. Each component page shows default, hover, focus, pressed, loading, disabled and no permission, with anatomy, do and don't, accessibility and keys. The examples are the real CSS, so the docs cannot drift from the product.
- A way to add things. New patterns start as a product need, get built in the product, then move into the system with their states and notes. The system has a version number so teams can say which one they are on.
10 / Accessibility
Built in, then checked.
- Every text pair meets WCAG AA in both themes; the ratios are computed live on the system page.
- Status is shape plus word plus colour. Chart colours were validated as a set for colour vision deficiency, with gaps between segments and a table view for each chart.
- Sortable headers are buttons with
aria-sort; the table is one Tab stop with arrow and j/k movement; tabs follow the WAI-ARIA pattern. - Live updates can be paused (WCAG 2.2.2). Toasts pause on hover and focus. Results and actions are announced through polite live regions; errors through an alert.
- Touch targets are 44px; compact density only applies with a fine pointer. Inputs are 16px on touch to stop iOS zooming.
- Reduced motion removes slides, shimmers and pulses; data still updates.
11 / Audit
I checked my own claims. Four did not hold.
On 11 November 2026, after this concept was published, I audited the live desk. Three passes: axe-core 4.10 on the overview, shipments and exceptions views at 375px and 1024px; a keyboard pass through the resolve flow; and a sweep for sideways scroll and small touch targets at 375px.
| Found | Changed |
|---|---|
| Critical. Below 760px the Desk and State lab buttons drop their text and become icons, with no name left for a screen reader. | Both buttons now carry a label at every width: "Desk settings" and "State lab". |
| The rider links on the overview were 20px tall on touch screens. Section 10 of this case said touch targets were 44px. | They are now 44px on touch and 24px with a mouse. The claim is true again. |
| The exceptions queue jumped from a level 1 heading straight to level 3. | Each exception title is now a level 2 heading, with the same look. The two empty states follow. |
| The concept notice at the top sat outside every landmark. | It is now a labelled region, so it shows up in a landmark list. |
What passed. The resolve dialog is modal and labelled, kept focus inside through 25 presses of Tab, closed on Escape and put focus back on Resolve. No view scrolls sideways at 375px. The row checkboxes look small but sit in a 44 by 56px hit area.
After the fixes, the same axe run reports no violations on all three views at 375px.
What it taught me. The contrast check in my build passed the whole time, and it caught none of this. A test only guards what it measures. Names, heading order and target size need their own checks, so the next change to the system is to run axe in the build next to the contrast pairs.
Limits: automated checks find only part of what a person would. I have not used a screen reader on this, or a real phone. Section 12 is still the real test.
12 / Next
What I would test, and how I would know.
Nothing here has been tested with real users. The first thing I would do is sit with five ops staff at a Lagos courier for a shift, then run moderated tasks on this prototype with their own data shapes.
- Task tests: resolve an address exception from a phone call; reassign everything from a broken down rider; find why a merchant's parcel is late from two phone digits; settle a short payment.
- Hypotheses: oldest first sorting reduces breaches compared with newest first; showing the money side by side cuts finance back and forth; a required landmark reduces repeat address exceptions.
- Measures once live: median time from exception opened to resolved; share of exceptions breaching 60 minutes; first attempt delivery rate; hours from cash collected to banked; how often Undo is used (a high rate means a confusing action).
- Open questions: whether dispatchers want a map after all for rider positions; whether 60 minutes is the right target; how merchants should see the same data.
13 / Honest limits
What this is not.
There is no backend: the 300 shipments are generated in the browser from a fixed seed, so every visitor sees the same day, and live updates are simulated. Riders, merchants, customers, plates and phone numbers are invented; the Lagos areas and streets are real. Proof of delivery photos are drawn placeholders, by design, since this concept uses no generated photography. The research is desk research with the sources listed above.